Speed Racer Gone Wrong: When CUDA Graph Optimization Killed My Inference Server
Why did my stable vLLM server keep crashing with CUDA OOM errors? The culprit: CUDA Graphs. For diverse workloads like structured JSON, graph capture + PyTorch's cache = a slow memory leak. I fixed it with one flag: --enforce-eager. Here's why I traded performance for stability.

I had finally stabilized my vLLM deployment. Qwen3-30B was running smoothly on a single H200. KV cache was under control. Memory utilization looked healthy at 75%. Everything was perfect. But seems like that was not the end of the story. The inference server was down. CUDA out of memory error.
I checked the metrics. Memory usage had been at 65% all day. The OOM happened suddenly, under normal load. No spike in traffic. No unusual requests. Just... crash.
I restarted the server. It ran fine for a while. Then crashed again. Different time, same error.
As you have guessed by now, this is article is about of hunting down one of the most frustrating bugs I've encountered: non-deterministic CUDA OOM errors caused by graph capture. And why I eventually disabled one of vLLM's core optimizations with a single flag: --enforce-eager.
The Pattern: Random OOMs Under Normal Load
The crashes followed no predictable pattern:
Crash 1: 8 active sequences, memory at 64%
Crash 2: 12 active sequences, memory at 68%
Crash 3: 6 active sequences, memory at 61%
Crash 4: 10 active sequences, memory at 67%
No correlation with load. No correlation with memory usage. The crashes seemed random.
The error message was always the same:
RuntimeError: CUDA out of memory. Tried to allocate 3.25 GiB (GPU 0; 140.54 GiB total capacity; 138.92 GiB already allocated; 1.12 GiB free; 139.50 GiB reserved in total by PyTorch)
Wait. "139.50 GiB reserved in total by PyTorch"?
My gpu-memory-utilization was 0.75, which should reserve around 106GB (75% of 141GB). Where did the extra 33GB come from?
What Are CUDA Graphs?
To understand what was happening, I needed to understand CUDA graphs.
The Problem CUDA Graphs Solve
When you run a neural network on a GPU, each operation (matrix multiply, activation function, normalization) is launched as a separate CUDA kernel. For a transformer forward pass, this means hundreds of kernel launches.
Each kernel launch has overhead:
- CPU submits work to GPU driver
- Driver validates the operation
- Driver schedules the kernel on GPU
- GPU begins execution
For small operations, this overhead can dominate execution time. A 0.1ms matrix multiply might have 0.05ms of launch overhead. That's 50% overhead!
For a 60-layer transformer, you might have:
- 60 attention layers × 10 operations = 600 operations
- 60 feed-forward layers × 8 operations = 480 operations
- Total: 1,080+ kernel launches per forward pass
At 0.05ms overhead each: 1,080 × 0.05ms = 54ms of pure launch overhead.
This is wasted time. The GPU could be computing, but instead it's waiting for the CPU to submit the next kernel.
How CUDA Graphs Work
CUDA graphs pre-record a sequence of operations into a graph data structure. Then you replay the entire graph with a single launch.
Instead of:
for each operation:
    launch_kernel(operation)  # 0.05ms overhead each
You do:
# One-time setup (graph capture)
start_recording()
for each operation:
    launch_kernel(operation)
end_recording()
create_graph()

# Runtime (replay)
launch_graph()  # Single 0.05ms overhead for entire graph
The graph is captured once, then replayed many times. Instead of 1,080 kernel launches, you have 1 graph launch.
The speedup is significant: 10-20% faster inference for typical workloads.
The Memory Cost
Here's the catch: graphs require memory.
When you capture a graph, CUDA allocates buffers for:
- Intermediate tensors: All temporary values between operations
- Parameter buffers: Pointers to weights and activations
- Graph metadata: Node structure, dependencies, scheduling info
- Memory pool: Pre-allocated workspace for graph execution
For a transformer forward pass, a single graph might allocate:
- Intermediate attention scores: 2-4GB
- Temporary buffers for normalization: 0.5-1GB
- Workspace for matrix multiplies: 1-2GB
- Graph metadata: 0.1-0.5GB
- Total: 4-8GB per unique graph
"Per unique graph" is the key phrase.
The Problem: Graph Diversity in vLLM
vLLM doesn't capture just one graph. It captures many graphs, because different request shapes require different execution patterns.
What Makes Graphs Different
A graph is "unique" based on:
- Batch size: 1 sequence vs 8 sequences vs 32 sequences
- Sequence lengths: Uniform lengths vs mixed lengths
- Number of tokens to generate: 10 tokens vs 100 tokens vs 500 tokens
- Attention patterns: Full attention vs causal attention
- KV cache state: Empty cache vs partially filled cache
In vLLM, every unique combination gets its own graph.
Example scenarios:
Scenario A: Batch of 8 sequences, all 2048 tokens long, generating 256 tokens each
- Graph A captures: attention with 8 sequences, KV cache growing from 2048 to 2304
Scenario B: Batch of 4 sequences, lengths [1024, 2048, 3072, 4096], generating 128 tokens each
- Graph B captures: different attention pattern, different KV cache sizes
Scenario C: Batch of 16 sequences, all 512 tokens, generating 50 tokens each
- Graph C captures: larger batch, smaller sequences
Each scenario creates a new graph. Each graph allocates 4-8GB.
The Graph Cache
vLLM maintains a graph cache. Once a graph is captured, it's reused for matching patterns.
The cache has a limit (typically 100-200 graphs). When you exceed this limit, old graphs are evicted.
But here's the problem: graphs aren't freed immediately.
CUDA graph memory is managed by PyTorch's caching allocator. When a graph is evicted from vLLM's cache, PyTorch doesn't necessarily free the memory. It keeps it in its memory pool, hoping to reuse it.
This means graph memory accumulates over time, even as old graphs are evicted.
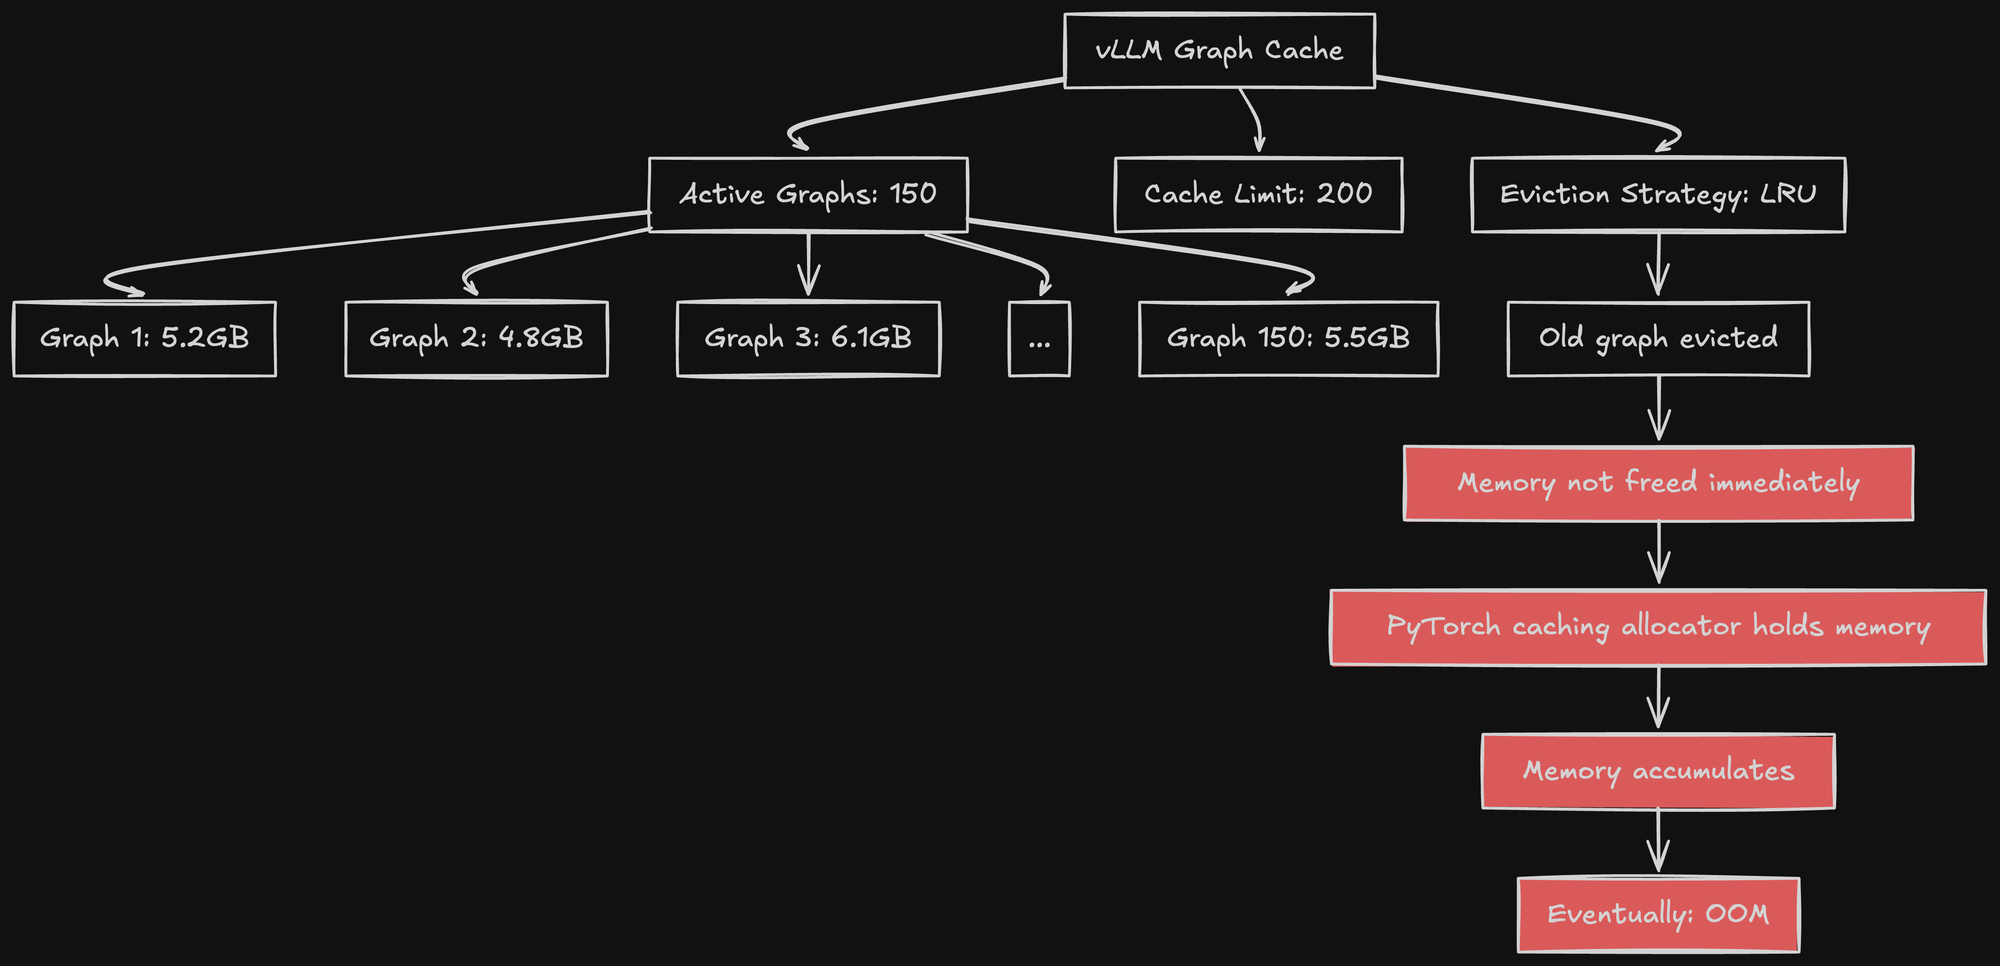
Over hours or days of operation, as request patterns vary, more and more graphs get captured. Memory usage creeps up. Eventually, you hit OOM.
My Workload: Structured Output with Diverse Schemas
My use case was uniquely bad for CUDA graphs.
I was running structured output generation with vLLM's guided decoding (Outlines backend). Each request had:
- A custom JSON schema (different per request)
- Variable input lengths (500-10,000 tokens)
- Variable output lengths (100-2,000 tokens)
- Different complexity (nested objects, arrays, enums)
Every request had a different execution pattern.
For chatbots with fixed system prompts and similar response lengths, you might have 10-20 unique graphs. These get captured once, then reused thousands of times. Graph memory is stable.
For structured output with diverse schemas, I was seeing 100+ unique graphs per hour. The graph cache was constantly churning. Memory kept growing.
Measuring Graph Memory Growth
I instrumented vLLM to log PyTorch memory stats:
import torch
print(torch.cuda.memory_summary())
Output after 1 hour of operation:
|                   | Reserved  | Allocated |
|-------------------|-----------|-----------|
| Active            | 106.2 GB  | 98.4 GB   |
| Cached            | 28.5 GB   | 0.0 GB    |
|-------------------|-----------|-----------|
| Total             | 134.7 GB  | 98.4 GB   |
"Reserved" is what PyTorch has claimed from CUDA. "Allocated" is what's actually in use.
106GB reserved for active allocations (model weights + KV cache). But 28.5GB reserved and cached, not in use. This is graph memory.
After 6 hours:
|                   | Reserved  | Allocated |
|-------------------|-----------|-----------|
| Active            | 108.1 GB  | 99.2 GB   |
| Cached            | 32.8 GB   | 0.0 GB    |
|-------------------|-----------|-----------|
| Total             | 140.9 GB  | 99.2 GB   |
Cached memory grew to 32.8GB. Total reserved: 140.9GB out of 141GB available.
I was on the edge of OOM. Any spike would crash the server.
After a while, it crashed.
Understanding PyTorch's Caching Allocator
The root issue is how PyTorch manages GPU memory.
Why PyTorch Caches Memory
GPU memory allocation is slow. Calling cudaMalloc() takes 1-5ms. For operations that run every few milliseconds, this overhead is unacceptable.
PyTorch's solution: allocate large blocks from CUDA once, then manage sub-allocations internally. When you free a tensor, PyTorch doesn't return memory to CUDA. It keeps it in a cache for future allocations.
This is great for performance. But it means memory usage only goes up, never down.
The Memory Lifecycle
- First allocation: PyTorch requests 2GB from CUDA
- Usage: You create tensors totaling 1.8GB
- Free: You delete those tensors
- Cache: PyTorch keeps the 2GB block, marks it as free
- Next allocation: You create new tensors totaling 1.5GB
- Reuse: PyTorch uses the cached 2GB block (no CUDA call needed)
Memory usage from CUDA's perspective: always 2GB, even when only 1.5GB is in use.
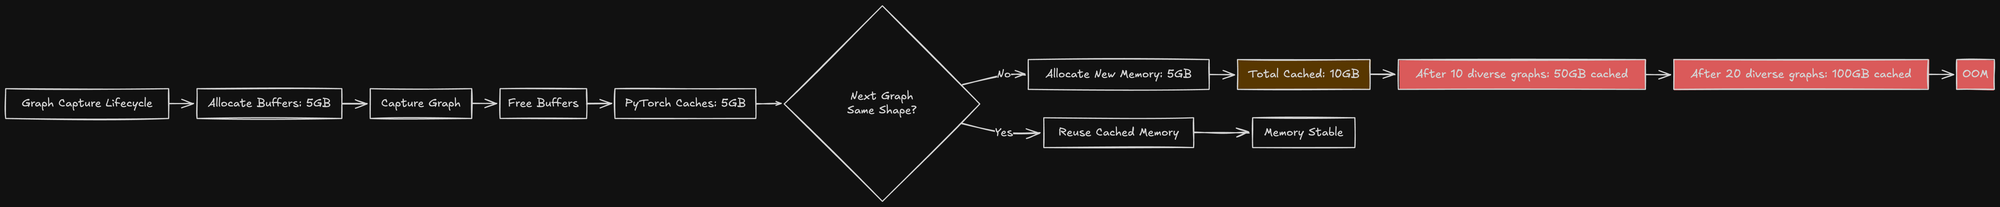
Graph Capture Amplifies This
Graph capture allocates many temporary buffers. These buffers are freed after capture completes. But PyTorch caches them.
For each new graph captured:
- Allocate 5GB of temporary buffers during capture
- Graph capture completes
- Buffers are freed (from PyTorch's perspective)
- PyTorch caches the 5GB (doesn't return to CUDA)
- Next graph capture uses this cached memory (if shapes match)
If next graph needs different shapes (different batch size, different sequence lengths), PyTorch can't reuse the cached memory. It allocates new memory.
After 100 diverse graphs, you've accumulated 30-40GB of cached, unused memory.
This is why OOMs happened hours after startup, not immediately. Memory leaked slowly as graph diversity accumulated.
The --enforce-eager Flag
vLLM provides a flag to disable graph capture entirely:
args:
  - --enforce-eager
"Eager" mode means operations are launched one at a time, as they're encountered. No graph capture. No graph replay.
This is the opposite of graph mode, which batches operations into pre-compiled graphs.
With --enforce-eager:
- No graph capture → no graph memory allocation
- No cached graph memory → memory usage is predictable
- No graph replay → 10-15% slower inference
It's a trade-off: stability vs performance.
Benchmarking: Eager vs Graph Mode
I ran benchmarks to measure the actual performance impact.
Test Setup
- 100 concurrent requests
- Input lengths: 2000 tokens (average)
- Output lengths: 500 tokens (average)
- Structured output with JSON schema constraints
- Measured: Time to First Token (TTFT), inter-token latency, throughput
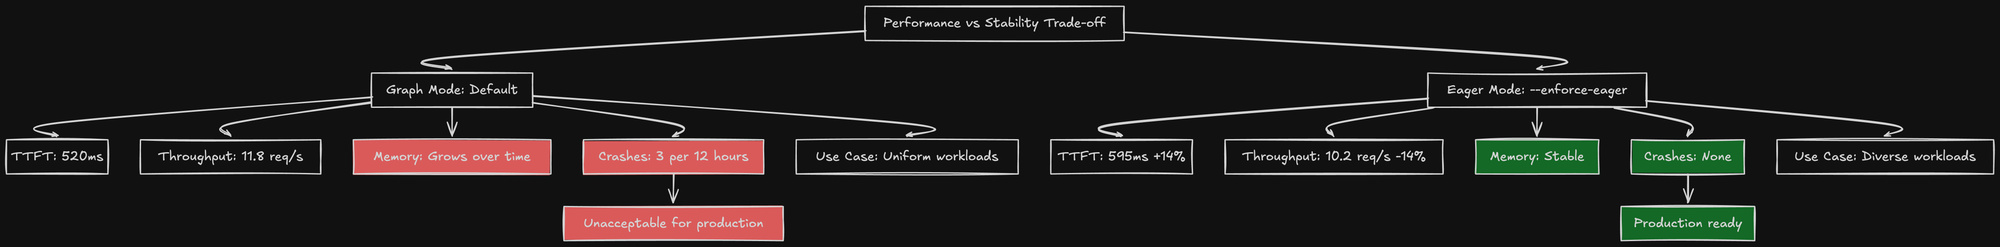
Results: Graph Mode (Default)
Configuration: Default (graph mode enabled)
TTFT: 520ms (p50), 780ms (p95)
Inter-token latency: 24ms (p50), 38ms (p95)
Throughput: 11.8 req/s
Memory usage: 99GB (startup) → 137GB (after 6 hours)
Crashes: 3 OOMs in 12 hours
Fast inference, but unstable.
Results: Eager Mode (--enforce-eager)
Configuration: --enforce-eager
TTFT: 595ms (p50), 890ms (p95)
Inter-token latency: 28ms (p50), 43ms (p95)
Throughput: 10.2 req/s
Memory usage: 99GB (startup) → 102GB (stable)
Crashes: 0 OOMs in 7 days
Slower inference, but completely stable.
The Trade-Off Analysis
TTFT degradation: 520ms → 595ms (14% slower)
Inter-token latency: 24ms → 28ms (17% slower)
Throughput reduction: 11.8 → 10.2 req/s (14% lower)
Stability improvement: 3 crashes/12hr → 0 crashes/7d (infinite improvement)
For my use case, stability won. Users don't care if responses take 595ms instead of 520ms. But they definitely care if the service crashes.
When CUDA Graphs Work Well
I'm not saying CUDA graphs are bad. They're excellent for the right workload.
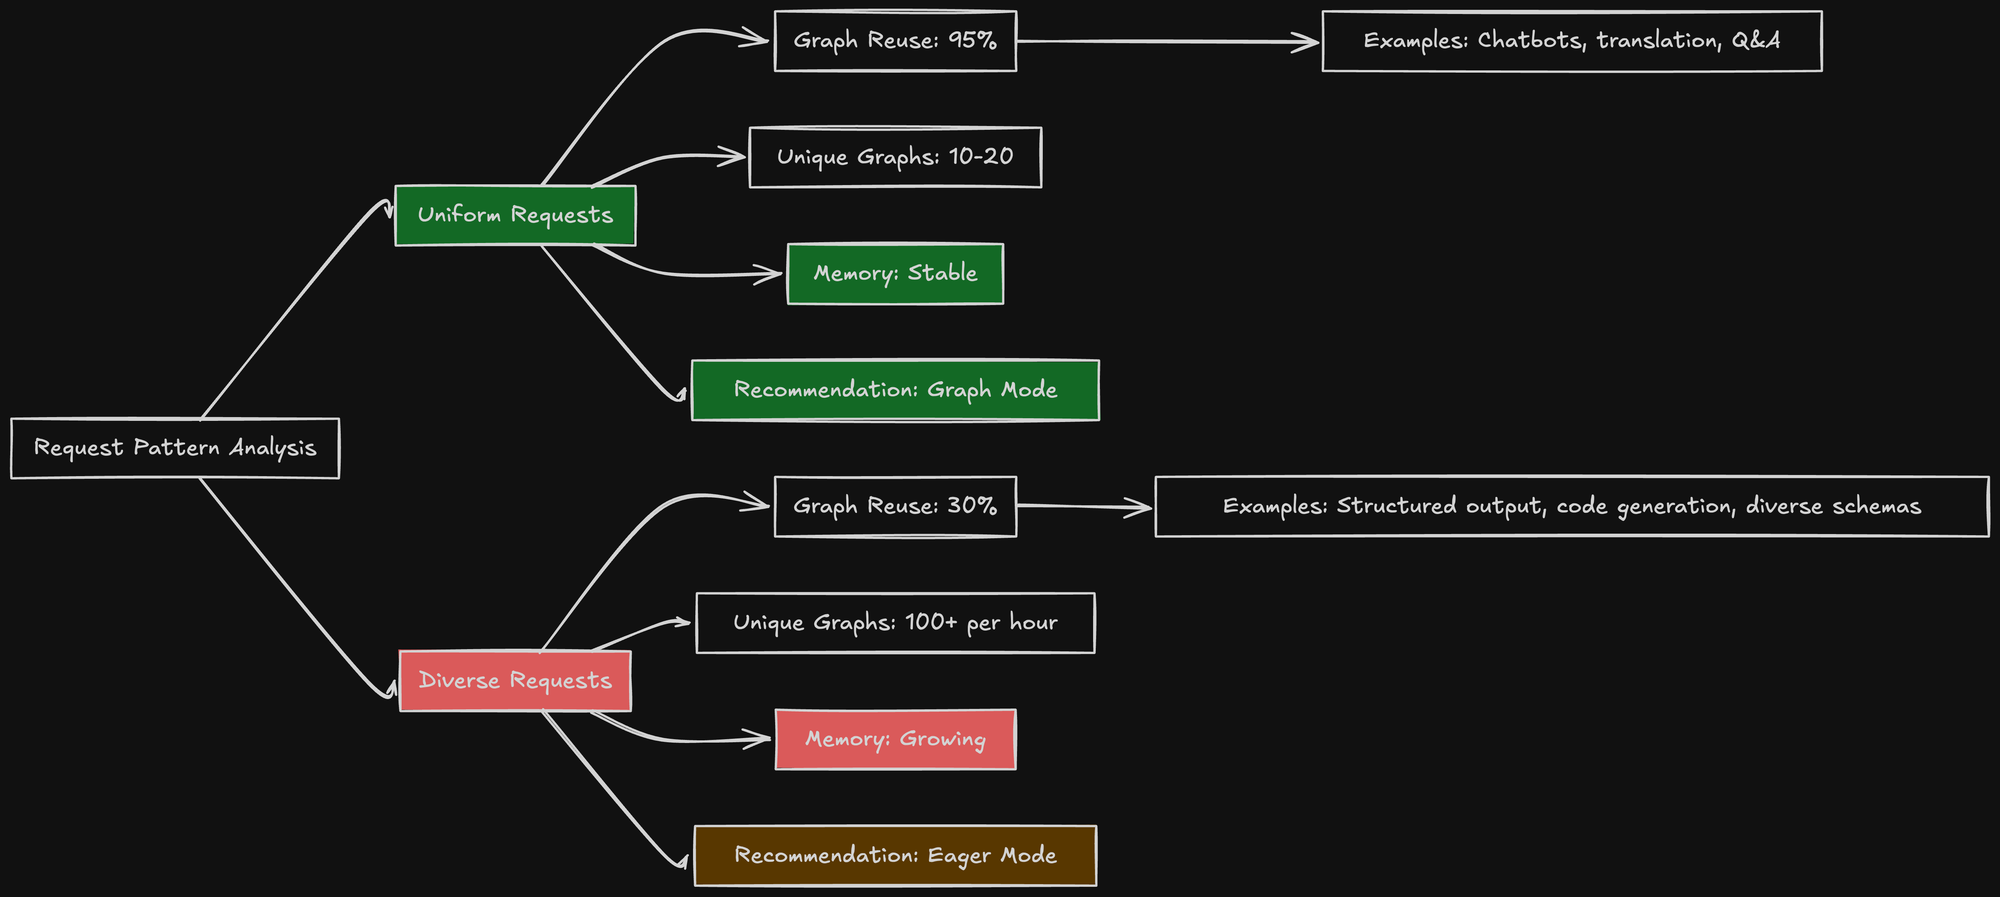
Ideal Workload for Graph Mode
Chatbots are the perfect use case:
- Fixed system prompt: Every request starts with the same 500-token system message
- Similar response lengths: Most responses are 100-300 tokens
- Predictable batching: Batch sizes are usually 8, 16, or 32
- Uniform patterns: Few unique execution paths
With this workload:
- 10-15 graphs capture 95% of requests
- Graph cache is stable (no constant eviction)
- Memory usage is predictable
- You get the full 10-15% performance benefit
Example: A customer support chatbot responding to product questions. The system prompt is fixed, responses are similar lengths, and the execution pattern is highly uniform. CUDA graphs give you free performance.
Bad Workload for Graph Mode
Structured output generation (my use case):
- Variable JSON schemas: Every request has a different schema (hundreds to thousands of unique schemas)
- Diverse input lengths: 500 to 10,000 token inputs
- Variable output lengths: 100 to 2,000 tokens
- Complex constraints: FSM-based guided decoding creates unique execution paths
With this workload:
- 100+ new graphs per hour
- Graph cache constantly churns
- Memory grows unpredictably
- Frequent OOMs
The performance benefit is negated by instability.
The Debugging Journey
Finding this root cause took me a while. Here's the process I went through.
Day 1: Is It the Model?
Initial hypothesis: The quantized model has a bug that causes OOM under certain inputs.
I tried:
- Switching from Qwen3-30B to Llama-3.1-70B (different OOM, worse performance)
- Reducing max-model-len from 60k to 32k (still crashed)
- Reducing gpu-memory-utilization from 0.75 to 0.70 (delayed crash by 2 hours)
None of these fixed it. The crash still happened, just at different times.
Day 2: Is It the KV Cache?
Hypothesis: KV cache is somehow growing beyond expected limits.
I instrumented KV cache logging:
def log_kv_cache_stats():
    print(f"KV blocks used: {num_blocks_used}")
    print(f"KV cache memory: {kv_cache_memory_gb:.2f} GB")
Output before crash:
KV blocks used: 3,872
KV cache memory: 60.2 GB
This was normal. KV cache wasn't the culprit.
Day 3: PyTorch Memory Deep Dive
I added detailed PyTorch memory logging:
import torch
snapshot = torch.cuda.memory_snapshot()
print(torch.cuda.memory_summary(device=0, abbreviated=False))
This revealed the "Cached" memory that kept growing. Following the PyTorch docs, I learned about the caching allocator and how graph capture interacts with it.
Then I found the vLLM issue on GitHub: "OOM with graph mode enabled for diverse workloads".
Others had the same problem. The recommended solution: --enforce-eager.
Validation
I enabled --enforce-eager and ran a 48-hour stress test:
- 10,000 requests with diverse JSON schemas
- Memory usage stable at 99-103GB
- No OOMs
- No degradation over time
Problem solved.
Production Configuration: The Stable Setup
Here's my final production configuration:
model: Qwen/Qwen3-30B-A3B-Instruct-2507
tensor-parallel-size: 1
max-model-len: 60000
gpu-memory-utilization: 0.75
max-num-seqs: 128
enable-chunked-prefill: true
enforce-eager: true
The last line is critical for my workload.
The 3-4GB variation is normal KV cache fluctuation based on request patterns. No memory leak, no growth, no crashes.
The Performance Impact in Practice
In production, the 14% throughput reduction is barely noticeable:
Before (graph mode):
- Throughput: 11.8 req/s
- Multiple crashes per day, requiring restarts (15-20 minutes downtime)
After (eager mode):
- Throughput: 10.2 req/s
- Crashes: 0 per month, no downtime
The "slower" configuration is actually faster in wall-clock time, because it doesn't crash and restart.
And for users, 595ms TTFT vs 520ms TTFT is imperceptible. Both feel instant.
Understanding the Eager Mode Implementation
What does --enforce-eager actually do in vLLM's code?
Default Path: Graph Capture
Without --enforce-eager, vLLM's forward pass looks like this:
def forward(self, input_ids, positions):
    # Check if we've seen this pattern before
    cache_key = (input_ids.shape, positions.shape)

    if cache_key in self.graph_cache:
        # Replay cached graph
        graph = self.graph_cache[cache_key]
        output = graph.replay(input_ids, positions)
        return output

    # New pattern: capture graph
    torch.cuda.synchronize()
    stream = torch.cuda.Stream()
    with torch.cuda.graph(stream) as g:
        output = self.model(input_ids, positions)

    # Store graph
    self.graph_cache[cache_key] = g
    return output
Every unique input shape triggers graph capture. The graph is cached for reuse.
Eager Path: Direct Execution
With --enforce-eager, vLLM's forward pass is simpler:
def forward(self, input_ids, positions):
    # Just run the model directly
    output = self.model(input_ids, positions)
    return output
No graph capture. No caching. Just execute operations as they're encountered.
This is "eager" execution: compute results immediately, don't optimize or pre-compile.
The Performance Difference
Why is eager mode slower?
- Kernel launch overhead: Each operation launches a kernel (~0.03-0.05ms overhead per operation)
- No kernel fusion: Operations run independently, can't be fused
- More CPU-GPU synchronization: CPU waits for each operation to complete
For a 60-layer transformer:
- Graph mode: 1 graph launch + ~10ms execution = ~10.03ms
- Eager mode: 1,080 kernel launches × 0.04ms + ~10ms execution = ~53ms
Wait, that predicts eager should be 5x slower, not 14% slower!
The reason it's only 14% slower in practice: most time is spent in large matrix multiplies, not launch overhead. A single attention operation might be 2-5ms of actual compute. Launch overhead is 0.04ms. That's only 1-2% overhead for large operations.
The 14% slowdown comes from:
- Small operations (normalization, activation functions) with high launch overhead
- Missed optimization opportunities (kernel fusion in graphs)
- Slightly worse memory access patterns (graphs can pre-allocate buffers optimally)
But for my workload, 14% slower is acceptable for infinite stability improvement.
Lessons Learned
1. Optimization Can Become Liability
CUDA graphs are a brilliant optimization. They make inferences 10-15% faster for typical workloads.
But for diverse workloads, they introduce memory leaks and non-deterministic crashes. The optimization becomes a liability.
Always benchmark optimizations for your specific workload. Don't assume defaults are optimal.
2. Memory "Reserved" vs "Allocated" Matters
PyTorch's caching allocator makes memory usage opaque. The GPU shows "138GB used", but PyTorch reports "99GB allocated" and "39GB cached".
Understanding this distinction is critical for debugging memory issues.
Use torch.cuda.memory_summary() to see the full picture, not just nvidia-smi.
3. Workload Diversity Is a Hidden Cost
Uniform workloads (chatbots) are easy to optimize. Diverse workloads (structured output) are hard.
Graph caching assumes pattern reuse. If every request is unique, caching becomes counterproductive.
For diverse workloads, eager execution can be faster (in wall-clock time) despite being slower (in per-request latency).
4. Stability > Performance for Production
A system that's 14% slower but never crashes is better than a system that's 14% faster but crashes daily.
Downtime is expensive:
- Lost revenue during outages
- Engineering time investigating crashes
- Customer trust erosion
In production, prioritize predictability over peak performance.
5. Disable Optimizations When Debugging
When I was debugging the random OOMs, I should have disabled CUDA graphs earlier in the process.
I spent 2 days assuming the problem was my configuration (KV cache size, GPU utilization, model quantization). Then I found it was an optimization I didn't even know was enabled.
When debugging GPU memory issues, disable all automatic optimizations first. Then re-enable them one by one.
Decision Tree: Graph Mode vs Eager Mode
Here's how I think about this choice now:
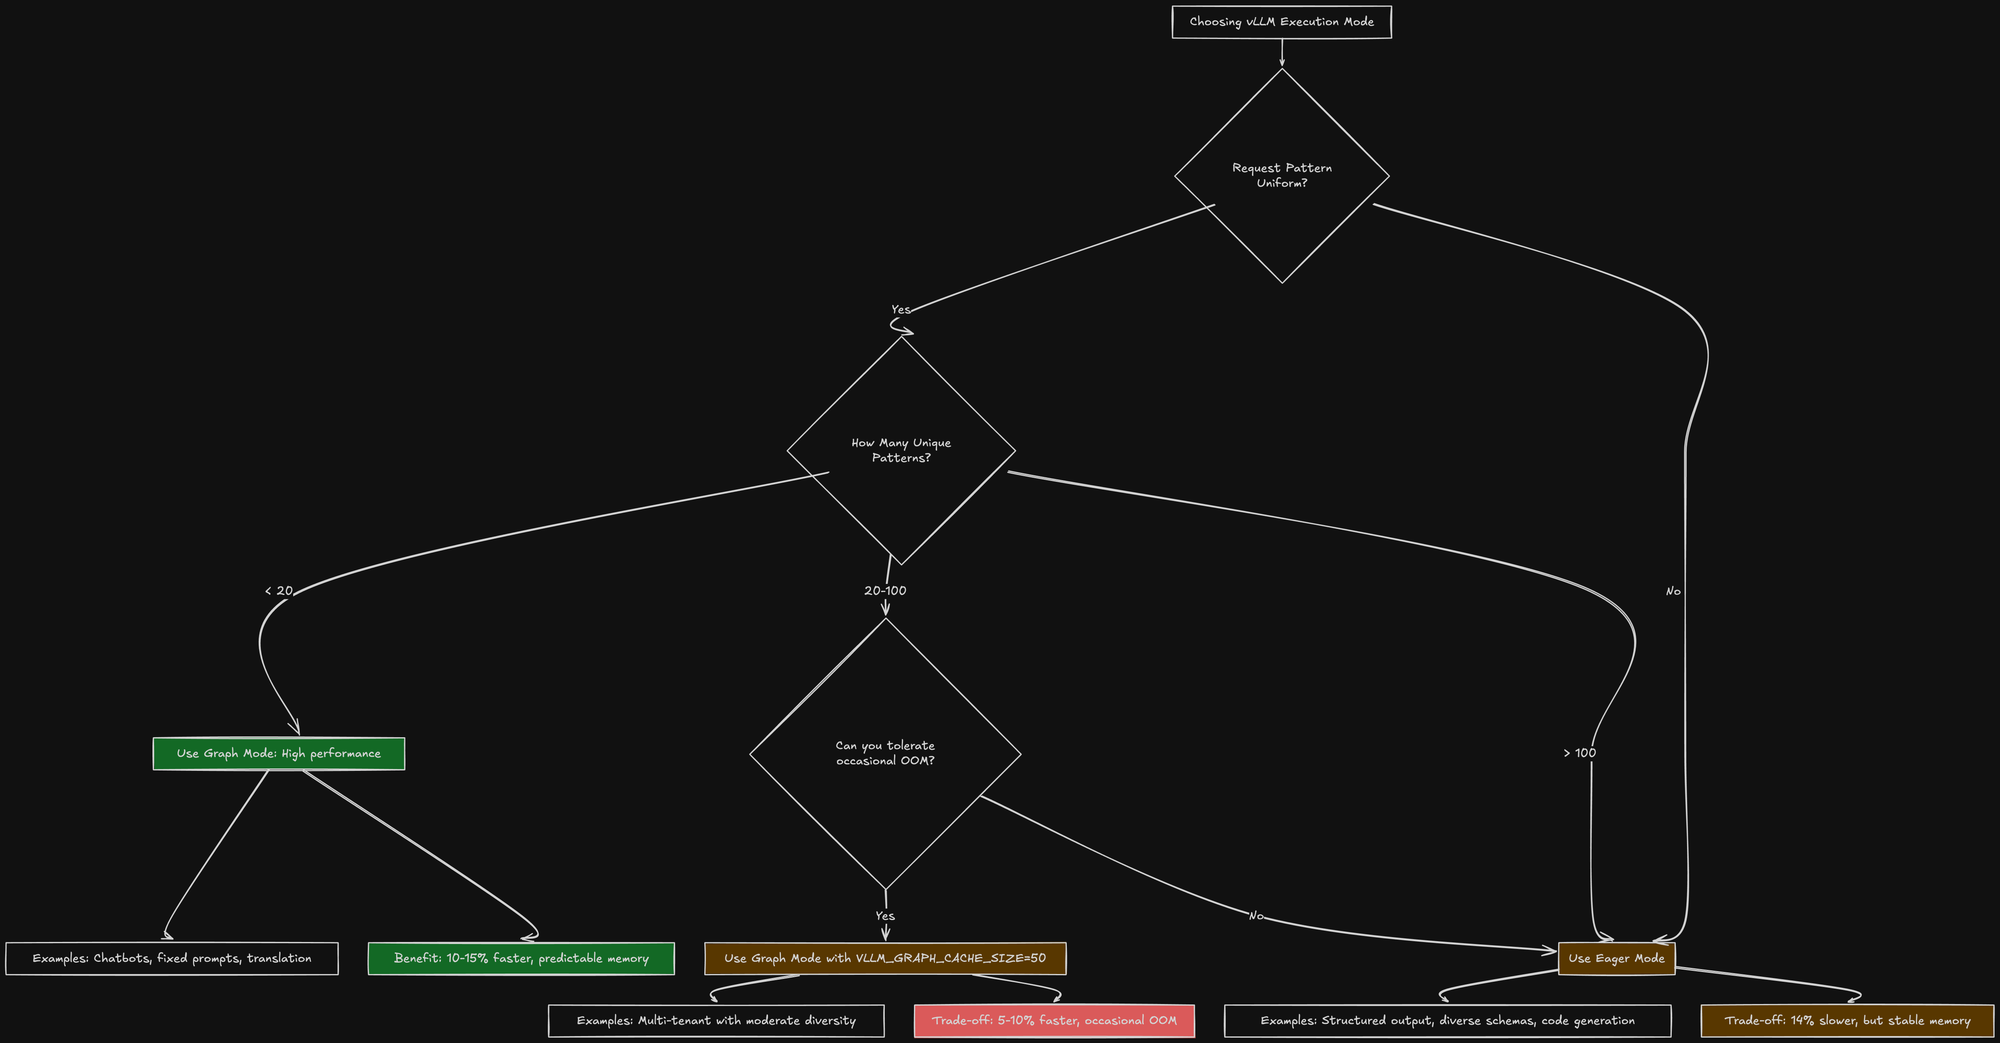
For production systems, I default to eager mode unless I have strong evidence that graph mode will be stable.
What's Next
This completes the four-part series on running LLMs in production:
- Quantization: Why 30B FP16 > 70B FP8 for structured output
- Tensor Parallelism: Why 1 GPU > 4 GPUs for cloud inference
- KV Cache: The invisible memory monster eating 60% of VRAM
- CUDA Graphs: When optimization kills stability
These four topics represent the hardest lessons I learned deploying vLLM at scale. Each one cost me days of debugging and multiple production outages.
But now, with the final configuration, my inference server has been running fine without a single crash. Memory is stable, performance is acceptable.
Sometimes the best optimization is disabling optimizations.
TL;DR: I had random CUDA OOM crashes despite memory usage looking normal. The culprit: CUDA graph capture for diverse workloads (structured output with variable JSON schemas) created 100+ unique graphs that accumulated 30-40GB of cached memory. PyTorch's caching allocator never freed this memory, causing OOMs after hours of operation. Solution: --enforce-eager flag disables graph capture, trading 14% performance for complete stability. For uniform workloads (chatbots), graph mode is great. For diverse workloads, eager mode is safer. In production, stability beats micro-optimizations.